Monitor CPU, RAM, Disk Usage and Docker health with Prometheus, Node Exporter & cAdvisor
Expand your monitoring stack to include detailed observability of CPU, memory, and disk usage. With Prometheus, node_exporter, and cAdvisor, you can track both server health and container performance.
Monitor CPU, RAM & Disk Usage with Prometheus, Node Exporter & cAdvisor
Following up on our Loki logging setup, this guide shows how to gain full visibility into your server’s CPU, memory (RAM), and disk usage—both for the host and for Docker containers.
We’ll use:
**Node Exporter** for server-level metrics like CPU load, memory pressure, and disk I/O

**cAdvisor** for container-level insights

**Prometheus** as the central scraper and storage backend
Keeping these in a single docker-compose file has some advantages such as :
-
Network isolation: Everything such as node exporter, cAdvisor and prometheus is on an isolated single network, connected together
-
Localhost Exporters: Metrics only bind to 127.0.0.1
-
Simple Exposure Only Prometheus (port 9090) is public-facing
This clean separation keeps your observability stack modular and secure. Monitoring Stack Docker Compose Create a folder containing docker-compose.yml and prometheus.yml for its configuration
Here’s the monitoring-specific docker-compose.yml: Note : I commented Node exporter because it couldnt deliver the correct free space on the server inside docker. so we will run it without docker
services:
  cadvisor:
    image: gcr.io/cadvisor/cadvisor:latest
    container_name: cadvisor
    volumes:
      - /:/rootfs:ro
      - /var/run:/var/run:ro
      - /sys:/sys:ro
      - /var/run/docker.sock:/var/run/docker.sock:ro
    ports:
      - "127.0.0.1:8080:8080"
    command:
      - '--housekeeping_interval=30s'
    restart: unless-stopped

  prometheus:
    image: prom/prometheus:latest
    network_mode: host
    volumes:
      - ./prometheus.yml:/etc/prometheus/prometheus.yml:ro
      - prometheus_data:/prometheus
    command:
      - '--config.file=/etc/prometheus/prometheus.yml'
      - '--storage.tsdb.path=/prometheus'
      - '--web.listen-address=127.0.0.1:9090'
      - '--web.external-url=/prometheus'
      - '--web.route-prefix=/prometheus'

volumes:
  prometheus_data:
Prometheus Scrape Configuration Prometheus scrapes metrics every 15 seconds:
global:
  scrape_interval: 15s

scrape_configs:
  - job_name: 'node_exporter'
    static_configs:
      - targets: ['127.0.0.1:9100']

  - job_name: 'cadvisor'
    metrics_path: /metrics
    static_configs:
      - targets: ['127.0.0.1:8080']

  # optional: monitor Loki itself
  #- job_name: 'loki'
  #  metrics_path: /metrics
  #  static_configs:
  #    - targets: ['127.0.0.1:3100']
If you dont want to open the port 9090 to the internet, use a reverse proxy such as Nginx
NGINX Configuration with Basic Auth Expose Prometheus securely using a reverse proxy with NGINX:
events {
worker_connections 1024;

}
http {

server {
        listen 80;

        server_name <YOUR SERVER IP>;
        client_max_body_size 10000M;


        # loki
        location /loki/ {
		auth_basic "Restricted Access";
    		auth_basic_user_file /etc/nginx/.loki_auth;

		proxy_pass http://localhost:3100;
		proxy_set_header Host $host;
		proxy_set_header X-Real-IP $remote_addr;
        	}

		# Prometheus
 	 location /prometheus/ {
    		auth_basic           "Restricted Access";
    		auth_basic_user_file /etc/nginx/.loki_auth;

 		# 1) strip /prometheus prefix before proxy
		#rewrite ^/prometheus(/.*)$ $1 break;

        	proxy_pass           http://127.0.0.1:9090/prometheus/;

        	proxy_set_header     Host               $host;
        	proxy_set_header     X-Real-IP          $remote_addr;
        	proxy_set_header     X-Forwarded-Proto  $scheme;
        	#proxy_set_header     X-Forwarded-Prefix /prometheus;

        	# 2) any 302/Location headers from Prometheus → /something
        	#    get rewritten back to /prometheus/something
        	#proxy_redirect       /   /prometheus/;

  		}

        }
}
Run node exporter without docker 1-Install the native node_exporter binary
cd /tmp
wget https://github.com/prometheus/node_exporter/releases/download/v1.6.1/node_exporter-1.6.1.linux-amd64.tar.gz
tar xzf node_exporter-1.6.1.linux-amd64.tar.gz
sudo mv node_exporter-1.6.1.linux-amd64/node_exporter /usr/local/bin/
then
vim /etc/systemd/system/node_exporter.service
and Paste in the following contents:
[Unit]
Description=Prometheus Node Exporter
After=network.target

[Service]
User=nobody
ExecStart=/usr/local/bin/node_exporter \
  --collector.filesystem.ignored-mount-points="^/(sys|proc|dev)($|/)" \
  --web.listen-address="0.0.0.0:9100"
Restart=always

[Install]
WantedBy=multi-user.target
Reload system
sudo systemctl daemon-reload
sudo systemctl enable --now node_exporter
verify its running
sudo systemctl status node_exporter
confirm you are scrapping free space
# Check raw metric
curl -s --get \
  --data-urlencode 'query=node_filesystem_avail_bytes{instance="127.0.0.1:9100",device="/dev/md2",mountpoint="/"}' \
  'http://127.0.0.1:9090/prometheus/api/v1/query?path_prefix=/prometheus' \
| jq -r '.data.result[0].value[1]' \
  | awk '{ printf("%.2f GiB\n", $1/1024/1024/1024) }'

# Compare to df
df -B1 / \
  | tail -1 \
  | awk '{ printf("%.2f GiB\n", $4/1024/1024/1024) }'
Test cdavisor use this commands on the server using curl to see if you get correct number of dockers and names
# Get containers that have actual Docker images (non-empty image field)
curl -s http://127.0.0.1:8080/metrics | grep 'container_last_seen' | grep 'image="[^"]\+' | wc -l

# Extract container names from the metrics
curl -s http://127.0.0.1:8080/metrics | grep 'container_last_seen' | grep 'image="[^"]\+' | grep -o 'name="[^"]*"' | cut -d'"' -f2
If it worked you can use followings in grafana
# Count of running Docker containers (containers with images)
count(container_last_seen{image!=""})
or
# Get container names and images
container_last_seen{image!=""}
or
# Container uptime (how long containers have been running)
(time() - container_start_time_seconds{image!=""}) / 3600
or
# Container memory usage
container_memory_usage_bytes{image!=""} / 1024 / 1024 / 1024
Visualizing CPU, RAM, and Disk Metrics You can now use either
http://YOUR-SERVER-IP/prometheus/
or Grafana to access the metrics.
Here is how you can use Grafana and connect the metrics to it: 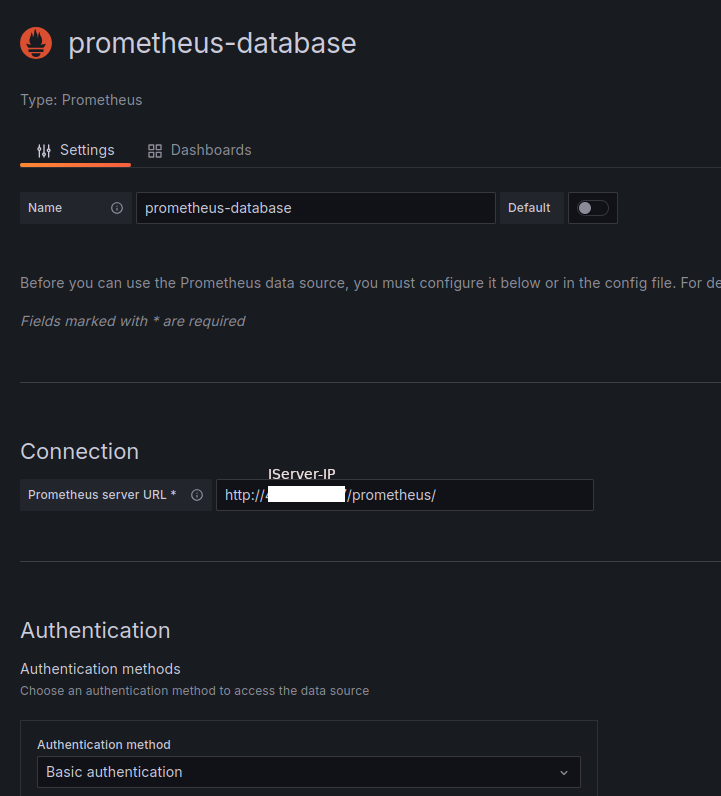 Once Grafana is connected to Prometheus:
Use dashboards like “Node Exporter Full” to see system metrics.

Import cAdvisor dashboards for container-level CPU/RAM/disk usage.
Conclusion
With Node Exporter and cAdvisor running, Prometheus collects detailed hardware and container insights, and Grafana helps visualize everything—from CPU spikes to disk saturation.
Json model of my current dashboard in Grafana
{
"annotations": {
"list": [
{
"builtIn": 1,
"datasource": {
"type": "grafana",
"uid": "-- Grafana --"
},
"enable": true,
"hide": true,
"iconColor": "rgba(0, 211, 255, 1)",
"name": "Annotations & Alerts",
"type": "dashboard"
}
]
},
"editable": true,
"fiscalYearStartMonth": 0,
"graphTooltip": 0,
"id": 3,
"links": [],
"panels": [
{
"collapsed": false,
"gridPos": {
"h": 1,
"w": 24,
"x": 0,
"y": 0
},
"id": 6,
"panels": [],
"title": "HDD",
"type": "row"
},
{
"collapsed": false,
"gridPos": {
"h": 1,
"w": 24,
"x": 0,
"y": 1
},
"id": 4,
"panels": [],
"title": "Row title",
"type": "row"
},
{
"datasource": {
"type": "prometheus",
"uid": "eekdg7mvm9gxsc"
},
"fieldConfig": {
"defaults": {
"color": {
"mode": "thresholds"
},
"mappings": [],
"thresholds": {
"mode": "absolute",
"steps": [
{
"color": "green"
}
]
}
},
"overrides": []
},
"gridPos": {
"h": 8,
"w": 12,
"x": 0,
"y": 2
},
"id": 9,
"options": {
"colorMode": "value",
"graphMode": "area",
"justifyMode": "auto",
"orientation": "auto",
"percentChangeColorMode": "standard",
"reduceOptions": {
"calcs": [
"lastNotNull"
],
"fields": "",
"values": false
},
"showPercentChange": false,
"textMode": "auto",
"wideLayout": true
},
"pluginVersion": "11.6.1",
"targets": [
{
"datasource": {
"type": "prometheus",
"uid": "eekdg7mvm9gxsc"
},
"editorMode": "code",
"expr": "count(container_last_seen{image!=\"\"})",
"legendFormat": "Running Containers",
"range": true,
"refId": "A"
}
],
"title": "Docker numbers (Running) ",
"type": "stat"
},
{
"datasource": {
"type": "prometheus",
"uid": "eekdg7mvm9gxsc"
},
"fieldConfig": {
"defaults": {
"color": {
"mode": "thresholds"
},
"mappings": [],
"thresholds": {
"mode": "absolute",
"steps": [
{
"color": "green"
}
]
},
"unit": "dtdurationms"
},
"overrides": []
},
"gridPos": {
"h": 8,
"w": 12,
"x": 12,
"y": 2
},
"id": 10,
"options": {
"minVizHeight": 75,
"minVizWidth": 75,
"orientation": "auto",
"reduceOptions": {
"calcs": [
"lastNotNull"
],
"fields": "",
"values": false
},
"showThresholdLabels": false,
"showThresholdMarkers": true,
"sizing": "auto"
},
"pluginVersion": "11.6.1",
"targets": [
{
"datasource": {
"type": "prometheus",
"uid": "eekdg7mvm9gxsc"
},
"editorMode": "code",
"exemplar": false,
"expr": "# Container uptime (how long containers have been running)\n(time() - container_start_time_seconds{image!=\"\"}) * 1000",
"format": "heatmap",
"instant": true,
"legendFormat": "{{name}} ",
"range": false,
"refId": "A"
}
],
"title": "Dockers Up time",
"type": "gauge"
},
{
"datasource": {
"type": "prometheus",
"uid": "eekdg7mvm9gxsc"
},
"fieldConfig": {
"defaults": {
"color": {
"mode": "palette-classic"
},
"custom": {
"hideFrom": {
"legend": false,
"tooltip": false,
"viz": false
}
},
"fieldMinMax": false,
"mappings": [],
"unit": "GB"
},
"overrides": []
},
"gridPos": {
"h": 8,
"w": 12,
"x": 0,
"y": 10
},
"id": 5,
"options": {
"displayLabels": [
"percent",
"name"
],
"legend": {
"displayMode": "list",
"placement": "bottom",
"showLegend": true,
"values": [
"value"
]
},
"pieType": "pie",
"reduceOptions": {
"calcs": [
"lastNotNull"
],
"fields": "",
"values": false
},
"tooltip": {
"hideZeros": false,
"mode": "single",
"sort": "none"
}
},
"pluginVersion": "11.6.1",
"targets": [
{
"datasource": {
"type": "prometheus",
"uid": "eekdg7mvm9gxsc"
},
"editorMode": "code",
"exemplar": false,
"expr": "(\n node_filesystem_size_bytes{\n instance=\"127.0.0.1:9100\",\n device=\"/dev/md2\",\n mountpoint=\"/\",\n fstype=\"ext4\"\n }\n -\n node_filesystem_avail_bytes{\n instance=\"127.0.0.1:9100\",\n device=\"/dev/md2\",\n mountpoint=\"/\",\n fstype=\"ext4\"\n }\n)\n/ (1024*1024*1024)\n",
"format": "time_series",
"hide": false,
"instant": true,
"legendFormat": "Used",
"range": false,
"refId": "A"
},
{
"datasource": {
"type": "prometheus",
"uid": "eekdg7mvm9gxsc"
},
"editorMode": "code",
"exemplar": false,
"expr": "node_filesystem_avail_bytes{\n instance=\"127.0.0.1:9100\",\n device=\"/dev/md2\",\n mountpoint=\"/\",\n fstype=\"ext4\"\n }\n/ (1024*1024*1024)",
"hide": false,
"instant": true,
"legendFormat": "Free",
"range": false,
"refId": "C"
}
],
"title": "HDD",
"transparent": true,
"type": "piechart"
},
{
"datasource": {
"type": "prometheus",
"uid": "eekdg7mvm9gxsc"
},
"fieldConfig": {
"defaults": {
"color": {
"mode": "palette-classic"
},
"custom": {
"axisBorderShow": false,
"axisCenteredZero": false,
"axisColorMode": "text",
"axisLabel": "",
"axisPlacement": "auto",
"barAlignment": 0,
"barWidthFactor": 0.6,
"drawStyle": "line",
"fillOpacity": 0,
"gradientMode": "none",
"hideFrom": {
"legend": false,
"tooltip": false,
"viz": false
},
"insertNulls": false,
"lineInterpolation": "linear",
"lineWidth": 1,
"pointSize": 5,
"scaleDistribution": {
"type": "linear"
},
"showPoints": "auto",
"spanNulls": false,
"stacking": {
"group": "A",
"mode": "none"
},
"thresholdsStyle": {
"mode": "off"
}
},
"mappings": [],
"thresholds": {
"mode": "absolute",
"steps": [
{
"color": "green"
},
{
"color": "red",
"value": 80
}
]
}
},
"overrides": []
},
"gridPos": {
"h": 8,
"w": 12,
"x": 12,
"y": 10
},
"id": 8,
"options": {
"legend": {
"calcs": [],
"displayMode": "list",
"placement": "bottom",
"showLegend": true
},
"tooltip": {
"hideZeros": false,
"mode": "single",
"sort": "none"
}
},
"pluginVersion": "11.6.1",
"targets": [
{
"datasource": {
"type": "prometheus",
"uid": "eekdg7mvm9gxsc"
},
"editorMode": "code",
"expr": "sum by (instance) (\n rate(node_disk_read_bytes_total{device!=\"loop*\"}[5m])\n)\n/ 1024 / 1024\n",
"legendFormat": "Read (MiB/s)",
"range": true,
"refId": "A"
},
{
"datasource": {
"type": "prometheus",
"uid": "eekdg7mvm9gxsc"
},
"editorMode": "code",
"expr": "sum by (instance) (\n rate(node_disk_written_bytes_total{device!=\"loop*\"}[5m])\n)\n/ 1024 / 1024",
"hide": false,
"instant": false,
"legendFormat": "Write (MiB/s)",
"range": true,
"refId": "B"
}
],
"title": "Disk I/O (MiB/S)",
"type": "timeseries"
},
{
"datasource": {
"type": "prometheus",
"uid": "eekdg7mvm9gxsc"
},
"fieldConfig": {
"defaults": {
"color": {
"mode": "palette-classic"
},
"custom": {
"axisBorderShow": true,
"axisCenteredZero": false,
"axisColorMode": "text",
"axisGridShow": false,
"axisLabel": "",
"axisPlacement": "auto",
"barAlignment": 0,
"barWidthFactor": 0.6,
"drawStyle": "line",
"fillOpacity": 13,
"gradientMode": "none",
"hideFrom": {
"legend": false,
"tooltip": false,
"viz": false
},
"insertNulls": false,
"lineInterpolation": "smooth",
"lineStyle": {
"fill": "solid"
},
"lineWidth": 3,
"pointSize": 5,
"scaleDistribution": {
"log": 2,
"type": "log"
},
"showPoints": "auto",
"spanNulls": false,
"stacking": {
"group": "A",
"mode": "none"
},
"thresholdsStyle": {
"mode": "off"
}
},
"mappings": [],
"thresholds": {
"mode": "absolute",
"steps": [
{
"color": "green"
},
{
"color": "red",
"value": 80
}
]
},
"unit": "GB"
},
"overrides": []
},
"gridPos": {
"h": 8,
"w": 12,
"x": 0,
"y": 18
},
"id": 3,
"options": {
"legend": {
"calcs": [],
"displayMode": "table",
"placement": "bottom",
"showLegend": true
},
"tooltip": {
"hideZeros": false,
"mode": "single",
"sort": "none"
}
},
"pluginVersion": "11.6.1",
"targets": [
{
"datasource": {
"type": "prometheus",
"uid": "eekdg7mvm9gxsc"
},
"editorMode": "code",
"expr": "(node_memory_MemTotal_bytes - node_memory_MemAvailable_bytes) / 1024 / 1024 / 1024\n\n\n",
"legendFormat": "Used RAM",
"range": true,
"refId": "A"
},
{
"datasource": {
"type": "prometheus",
"uid": "eekdg7mvm9gxsc"
},
"editorMode": "code",
"expr": "node_memory_MemTotal_bytes / 1024 / 1024 / 1024",
"hide": false,
"instant": false,
"legendFormat": "Total RAM",
"range": true,
"refId": "B"
}
],
"title": "RAM usage GB",
"transparent": true,
"type": "timeseries"
},
{
"datasource": {
"type": "prometheus",
"uid": "eekdg7mvm9gxsc"
},
"fieldConfig": {
"defaults": {
"color": {
"mode": "palette-classic"
},
"custom": {
"axisBorderShow": false,
"axisCenteredZero": false,
"axisColorMode": "text",
"axisLabel": "",
"axisPlacement": "auto",
"barAlignment": 0,
"barWidthFactor": 0.6,
"drawStyle": "line",
"fillOpacity": 0,
"gradientMode": "none",
"hideFrom": {
"legend": false,
"tooltip": false,
"viz": false
},
"insertNulls": false,
"lineInterpolation": "linear",
"lineWidth": 1,
"pointSize": 5,
"scaleDistribution": {
"type": "linear"
},
"showPoints": "auto",
"spanNulls": false,
"stacking": {
"group": "A",
"mode": "none"
},
"thresholdsStyle": {
"mode": "off"
}
},
"mappings": [],
"thresholds": {
"mode": "absolute",
"steps": [
{
"color": "green"
},
{
"color": "red",
"value": 80
}
]
}
},
"overrides": []
},
"gridPos": {
"h": 8,
"w": 12,
"x": 12,
"y": 18
},
"id": 2,
"options": {
"legend": {
"calcs": [],
"displayMode": "list",
"placement": "bottom",
"showLegend": true
},
"tooltip": {
"hideZeros": false,
"mode": "single",
"sort": "none"
}
},
"pluginVersion": "11.6.1",
"targets": [
{
"datasource": {
"type": "prometheus",
"uid": "eekdg7mvm9gxsc"
},
"editorMode": "code",
"expr": "avg by(instance) (\n rate(node_cpu_seconds_total{mode=\"idle\"}[5m])\n) * 100",
"legendFormat": "Idle %",
"range": true,
"refId": "A"
},
{
"datasource": {
"type": "prometheus",
"uid": "eekdg7mvm9gxsc"
},
"editorMode": "code",
"expr": "100\n- avg by(instance) (\n rate(node_cpu_seconds_total{mode=\"idle\"}[5m])\n ) * 100",
"hide": false,
"instant": false,
"legendFormat": "busy %",
"range": true,
"refId": "B"
}
],
"title": "Cpu usage Percentage",
"type": "timeseries"
},
{
"datasource": {
"type": "prometheus",
"uid": "eekdg7mvm9gxsc"
},
"fieldConfig": {
"defaults": {
"color": {
"mode": "palette-classic"
},
"custom": {
"axisBorderShow": false,
"axisCenteredZero": false,
"axisColorMode": "text",
"axisLabel": "",
"axisPlacement": "auto",
"barAlignment": 0,
"barWidthFactor": 0.6,
"drawStyle": "line",
"fillOpacity": 0,
"gradientMode": "none",
"hideFrom": {
"legend": false,
"tooltip": false,
"viz": false
},
"insertNulls": false,
"lineInterpolation": "linear",
"lineWidth": 1,
"pointSize": 5,
"scaleDistribution": {
"type": "linear"
},
"showPoints": "auto",
"spanNulls": false,
"stacking": {
"group": "A",
"mode": "none"
},
"thresholdsStyle": {
"mode": "off"
}
},
"mappings": [],
"thresholds": {
"mode": "absolute",
"steps": [
{
"color": "green"
},
{
"color": "red",
"value": 80
}
]
}
},
"overrides": []
},
"gridPos": {
"h": 8,
"w": 12,
"x": 0,
"y": 26
},
"id": 1,
"options": {
"legend": {
"calcs": [],
"displayMode": "list",
"placement": "bottom",
"showLegend": true
},
"tooltip": {
"hideZeros": false,
"mode": "single",
"sort": "none"
}
},
"pluginVersion": "11.6.1",
"targets": [
{
"datasource": {
"type": "prometheus",
"uid": "eekdg7mvm9gxsc"
},
"editorMode": "code",
"exemplar": false,
"expr": "sum(\n rate(node_network_receive_bytes_total{device!=\"lo\"}[5m])\n)\n/ 1024 / 1024\n\n\n",
"instant": false,
"legendFormat": "Incomming",
"range": true,
"refId": "A"
},
{
"datasource": {
"type": "prometheus",
"uid": "eekdg7mvm9gxsc"
},
"editorMode": "code",
"expr": "sum(\n rate(node_network_transmit_bytes_total{device!=\"lo\"}[5m])\n/ 1024 / 1024\n)",
"hide": false,
"instant": false,
"legendFormat": "outcomming bandwitch",
"range": true,
"refId": "B"
}
],
"title": "Bandwitch (MB/S)",
"type": "timeseries"
}
],
"preload": false,
"schemaVersion": 41,
"tags": [],
"templating": {
"list": []
},
"time": {
"from": "now-15m",
"to": "now"
},
"timepicker": {},
"timezone": "browser",
"title": "internal resources Databse server",
"uid": "eekdkakbbta80a",
"version": 21
}