How to Deploy a Grafana Server in Your VPS for Small Team Use
Set up Grafana easily inside a VPS with Docker Compose and start building dashboards with your team. Learn how to integrate external Loki logs securely through NGINX authentication.
How to Deploy a Grafana Server in Your VPS for Small Team Use
Setting up Grafana on a VPS is a simple and powerful way to create a centralized dashboard system for your small team.
Here’s how you can do it step-by-step.
Step 1: Docker Compose File
Create a docker-compose.yaml file on your VPS:
services: grafana: image: grafana/grafana:latest container_name: grafana restart: unless-stopped environment: - GF_INSTALL_PLUGINS=grafana-clock-panel,grafana-polystat-panel

- GF_SECURITY_ADMIN_PASSWORD=YourSecurePassword ports: - '3000:3000' volumes: - 'grafana_storage:/var/lib/grafana' volumes: grafana_storage: {}
Step 2: Open Port 3000
Make sure your VPS firewall allows traffic on port 3000. If you are using UFW:
sudo ufw allow 3000
Or if you are using a cloud provider's firewall, open TCP port 3000 there.
Step 3: Access and Login
On your local machine, access Grafana using:
:3000
Login with:
Username: **admin**

Password: **YourSecurePassword**
You are now ready to create dashboards!
Step 4: Connecting Loki Logs with Basic Auth via NGINX
If you have Loki logs behind an NGINX server with Basic Authentication (as described in my detailed post Secure Loki Access with NGINX Authentication), you can connect it as shown below.
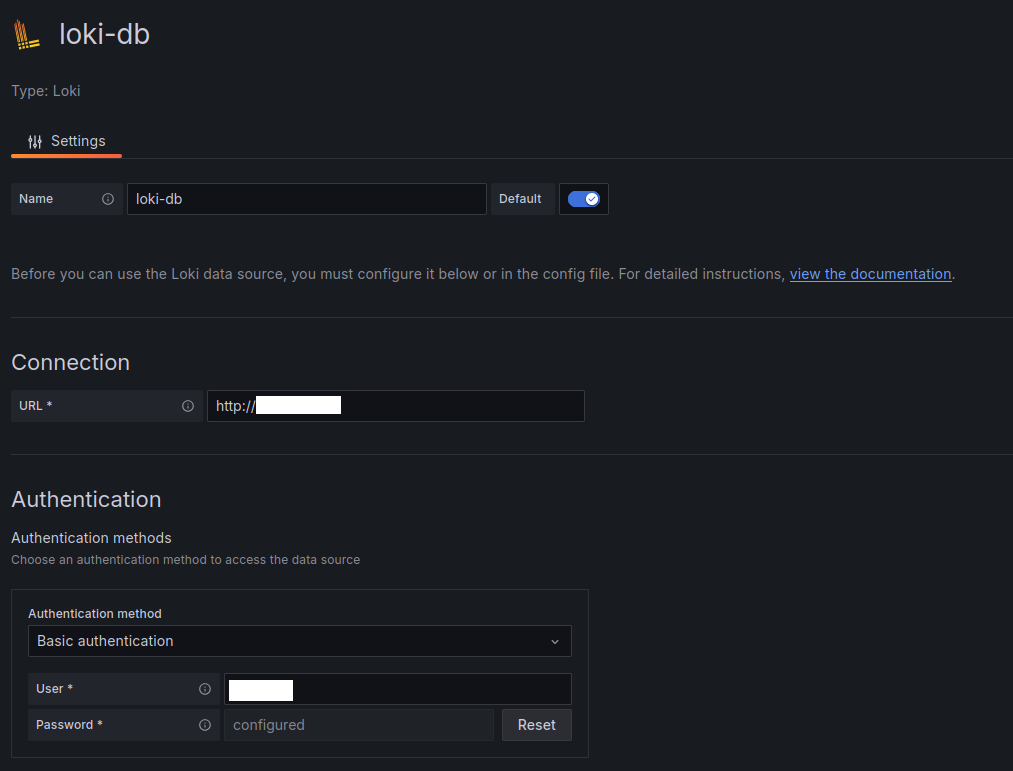
Under Connection, input your protected Loki URL, and for Authentication, select Basic authentication.
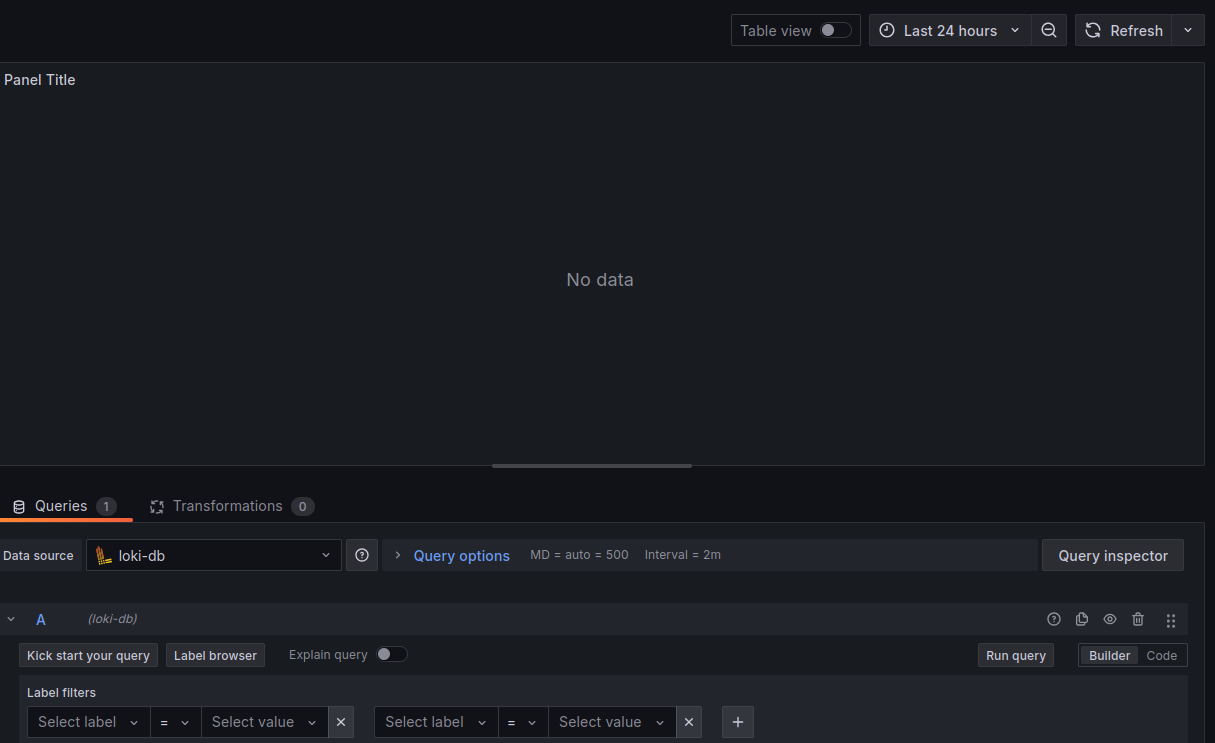
Step 5: Create Dashboards and Query Logs
Once the data source is configured, you can build panels and queries.
First, you may see "No data":
After setting the correct label filters and queries, your logs will start appearing:
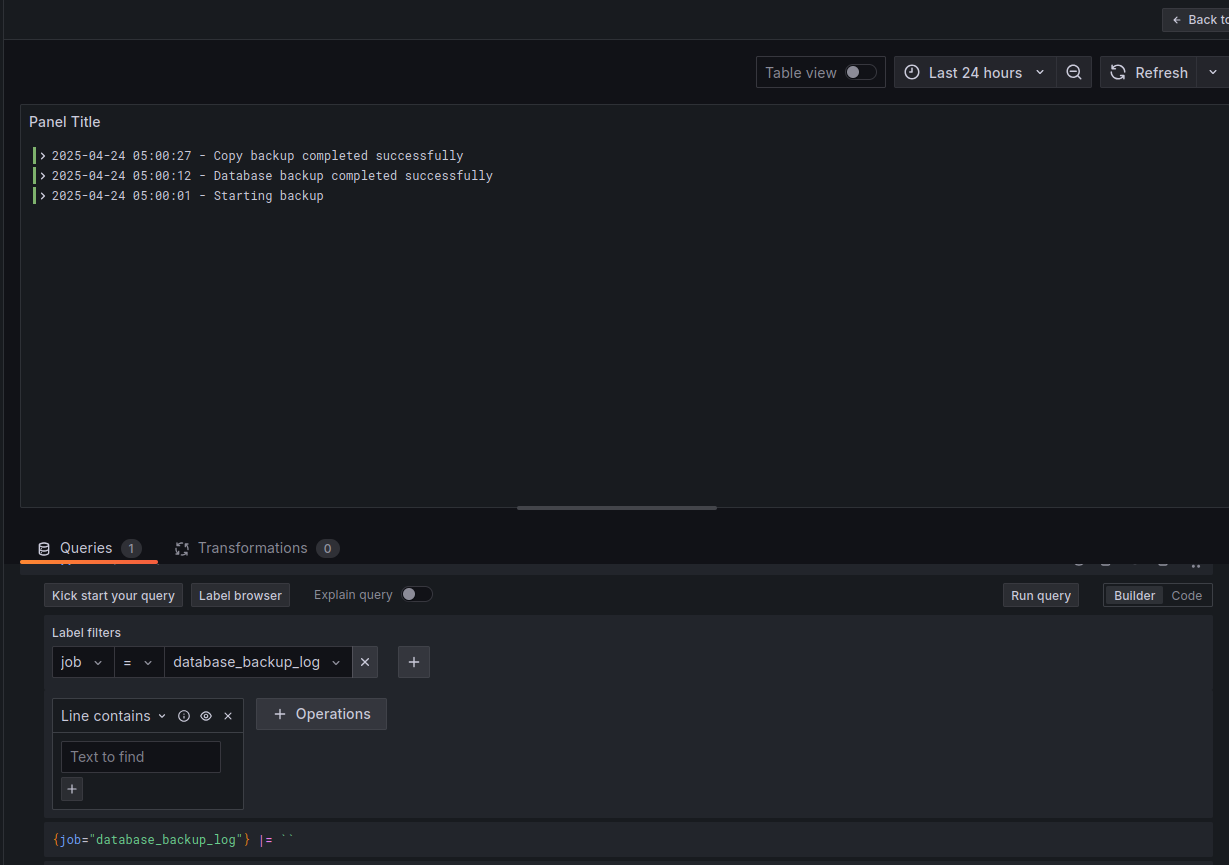
You can query for a specific job, like
database_backup_log
, to monitor your backups easily!
Conclusion
Deploying Grafana with Docker inside a VPS is a lightweight and effective solution for team dashboards. Securing your Loki logs via NGINX Basic Auth keeps your observability data safe while being easily accessible.